Chapter 4: Real Project Application — Your First Visual, Version-Controlled Deliverable
20 Minutes to Professional Results
Now we apply everything — Mermaid diagrams, Git version control, and visual tools — to create a real deliverable from your actual work. Choose a project path that matches your needs.
Choose Your Project Path
Select the project most relevant to your work:
Path A: Research Documentation Package
Perfect for: Academics, Researchers, PhD Students
Path B: Business Process & Reporting
Perfect for: Executives, Consultants, Project Managers
Path C: Technical System Documentation
Perfect for: Engineers, IT Professionals, Analysts
Path D: Creative Project Portfolio
Perfect for: Designers, Writers, Marketing Professionals
Path A: Research Documentation Package
Project: Visualised Research Methodology with Full Version History
Step 1: Project Setup (2 minutes)
Create this structure in VS Code and initialise Git:
research-docs/
├── methodology/
│   └── approach.md
├── timeline/
│   └── project-plan.md
├── analysis/
│   └── data-flow.md
└── README.md
cd research-docs
git init
Step 2: Research Methodology Diagram (5 minutes)
File: methodology/approach.md
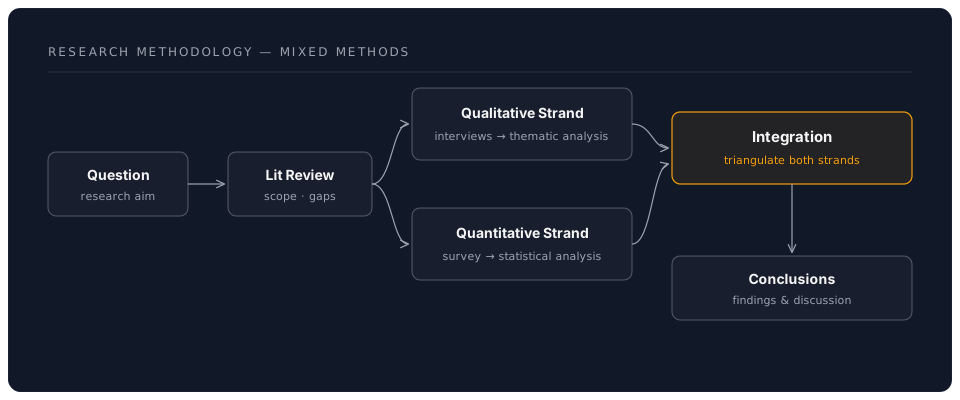
Write a brief description of your research approach, then create a Mermaid flowchart:
# Research Methodology

## Overview
This study uses a mixed-methods approach combining qualitative
interviews with quantitative survey data.

## Methodology Flow
Commit: docs: add research methodology flowchart
Step 3: Project Timeline (5 minutes)
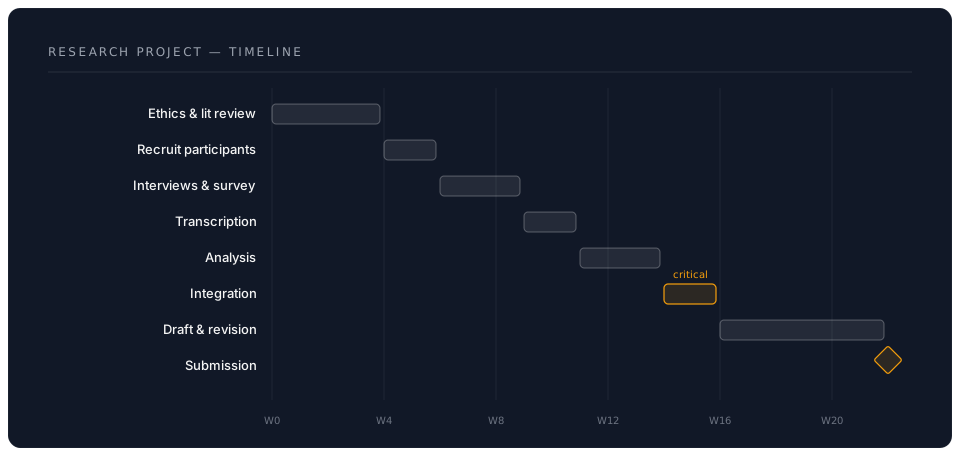
File: timeline/project-plan.md
Create a Gantt chart for your research schedule:
Commit: docs: add research project Gantt timeline
Step 4: Data Flow Diagram (5 minutes)
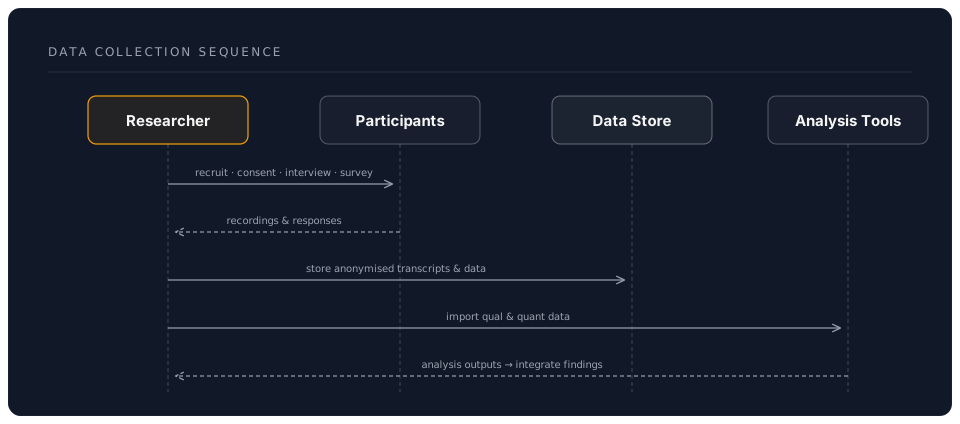
File: analysis/data-flow.md
Create a sequence diagram showing data collection and analysis:
Commit: docs: add data collection sequence diagram
Step 5: Push to GitHub (3 minutes)
git remote add origin https://github.com/YOUR-USERNAME/research-docs.git
git push -u origin main
Deliverable
A complete, version-controlled research documentation package with three professionally rendered diagrams.
Path B: Business Process & Reporting
Project: Visual Quarterly Review with Version-Tracked Documentation
Step 1: Project Setup (2 minutes)
business-review/
├── processes/
│   └── client-journey.md
├── planning/
│   └── q3-roadmap.md
├── reporting/
│   └── team-workflow.md
└── README.md
Initialise Git and commit the structure.
Step 2: Client Journey Flowchart (5 minutes)
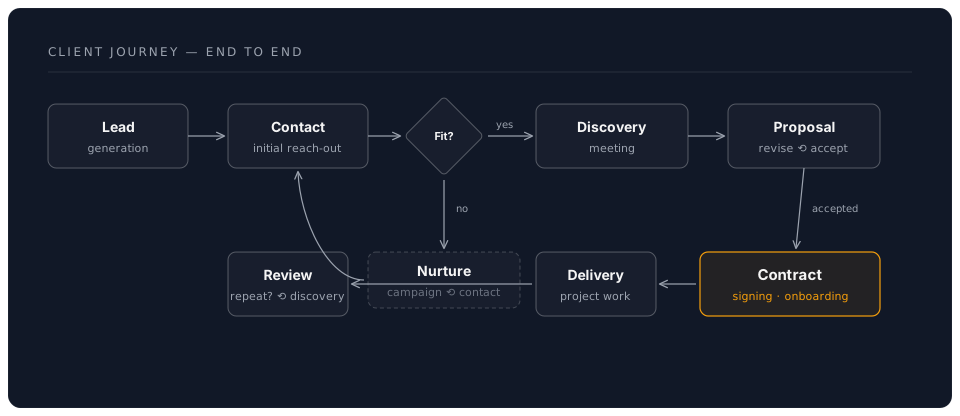
File: processes/client-journey.md
# Client Journey Map

## End-to-End Process
Commit: docs: add client journey flowchart
Step 3: Quarterly Roadmap (5 minutes)
File: planning/q3-roadmap.md
Create a Gantt chart for the quarter's major initiatives. Use real or realistic project names from your work.
Commit: docs: add Q3 roadmap Gantt chart
Step 4: Team Workflow Diagram (5 minutes)
File: reporting/team-workflow.md
Create a sequence diagram showing how a deliverable moves through your team (e.g., from request through review to delivery).
Commit: docs: add team workflow sequence diagram
Step 5: Push to GitHub (3 minutes)
Create a private repository on GitHub and push your work.
Deliverable
A professional business documentation suite demonstrating process clarity and project planning.
Path C: Technical System Documentation
Project: System Architecture with Visual Documentation
Step 1: Project Setup (2 minutes)
system-docs/
├── architecture/
│   └── overview.md
├── workflows/
│   └── deployment.md
├── integrations/
│   └── data-flow.md
└── README.md
Step 2: Architecture Overview (5 minutes)
File: architecture/overview.md
Document a system you work with using a Mermaid graph:
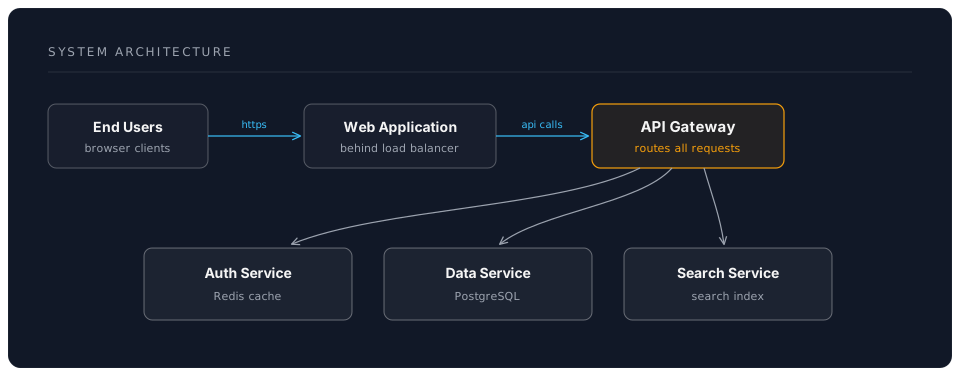
Commit: docs: add system architecture overview diagram
Step 3: Deployment Workflow (5 minutes)
File: workflows/deployment.md
Create a sequence diagram showing your deployment or release process.
Commit: docs: add deployment workflow sequence diagram
Step 4: Data Flow (5 minutes)
File: integrations/data-flow.md
Create a flowchart showing how data moves through your system, including decision points and error handling.
Commit: docs: add data flow integration diagram
Step 5: Push to GitHub (3 minutes)
Push to a private repository.
Deliverable
Technical documentation suitable for onboarding new team members or presenting to stakeholders.
Path D: Creative Project Portfolio
Project: Visual Case Study with Version History
Step 1: Project Setup (2 minutes)
portfolio-case/
├── process/
│   └── creative-workflow.md
├── timeline/
│   └── project-phases.md
├── outcomes/
│   └── impact-summary.md
└── README.md
Step 2: Creative Workflow Visualisation (5 minutes)
File: process/creative-workflow.md
Document a creative process (e.g., brand design, campaign development, content creation):
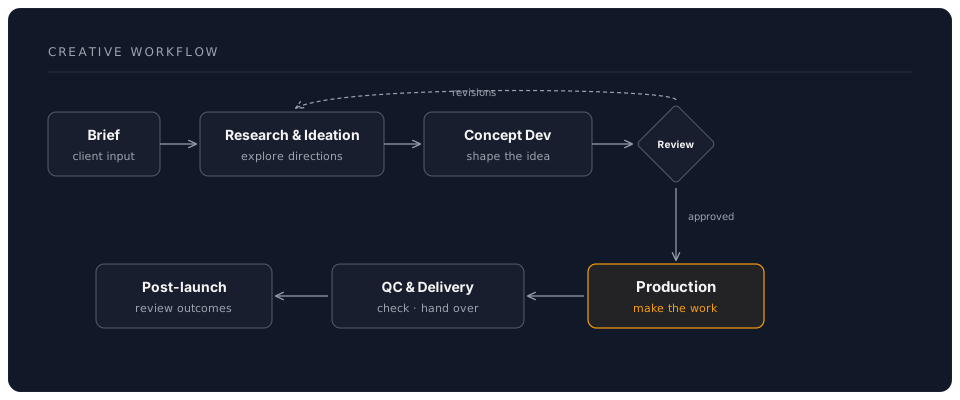
Commit: docs: add creative workflow diagram
Step 3: Project Phases (5 minutes)
File: timeline/project-phases.md
Create a Gantt chart showing a real or example project timeline with creative phases (research, concepts, production, delivery).
Commit: docs: add project phases Gantt chart
Step 4: Impact Summary (5 minutes)
File: outcomes/impact-summary.md
Use a mind map to visualise the outcomes and impact of the project:
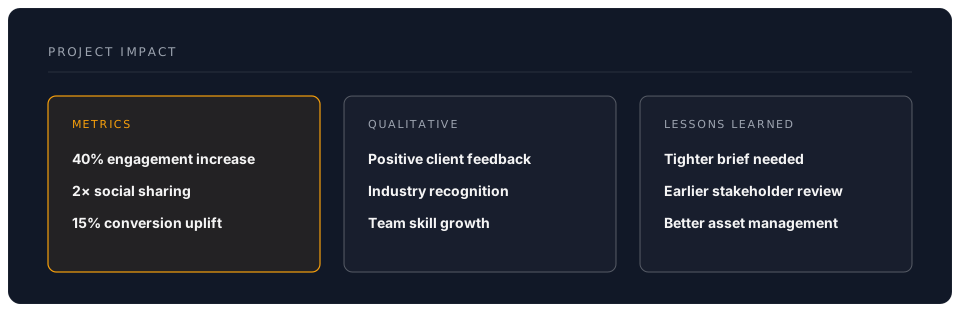
Commit: docs: add project impact mind map
Step 5: Push to GitHub (3 minutes)
Create a public repository (this is portfolio content!) and push.
Deliverable
A portfolio-ready case study demonstrating your creative process and measurable outcomes.
Universal Project Completion Checklist
Regardless of path chosen:
- Project folder structure created and logical
- At least 3 Mermaid diagrams (different types) included
- Git repository initialised with at least 4 meaningful commits
- Commit messages follow conventional format (
docs:,feat:, etc.) - Diagrams render correctly in VS Code Markdown preview
- README.md provides clear project overview
- (Stretch) Pushed to GitHub and visible on your profile
Time Analysis
Calculate your efficiency gain:
- Traditional approach (Word/PowerPoint/Visio): ___ hours estimated
- Visual version control approach: 20 minutes actual
- Time saved: ___ hours
- Quality comparison: Which approach produces more maintainable documentation?
Reflection Questions
- Which diagram type was most useful for your work?
- How does having a commit history change your confidence in making edits?
- What other projects from your work could benefit from this approach?
- Would you share this repository with a colleague? Why or why not?
- How could you use Claude Code to generate the initial Mermaid diagrams even faster?
What You've Demonstrated
In 20 minutes, you've created what traditionally takes hours:
- Professional diagrams that update when you edit text
- Complete version history showing every change you made
- Cloud backup (if pushed to GitHub) ensuring nothing is lost
- Shareable documentation that anyone can read and contribute to
This isn't about replacing your expertise — it's about removing friction so you spend more time on substance and less on formatting.